
Statistical Process Control (SPC)
Turn Process Variation Into Actionable Signals
Every process has variation — the question is whether that variation is normal, expected noise, or an early sign that something is drifting out of control. Statistical Process Control (SPC) applies proven statistical methods to real-time process data, giving your team an automated, continuous way to tell the difference — instead of relying on manual spot-checks or discovering a problem only after it shows up in final product quality.
Capstone Technology Canada implements online SPC that runs directly against your live process data, monitoring every relevant variable continuously rather than through periodic manual sampling.
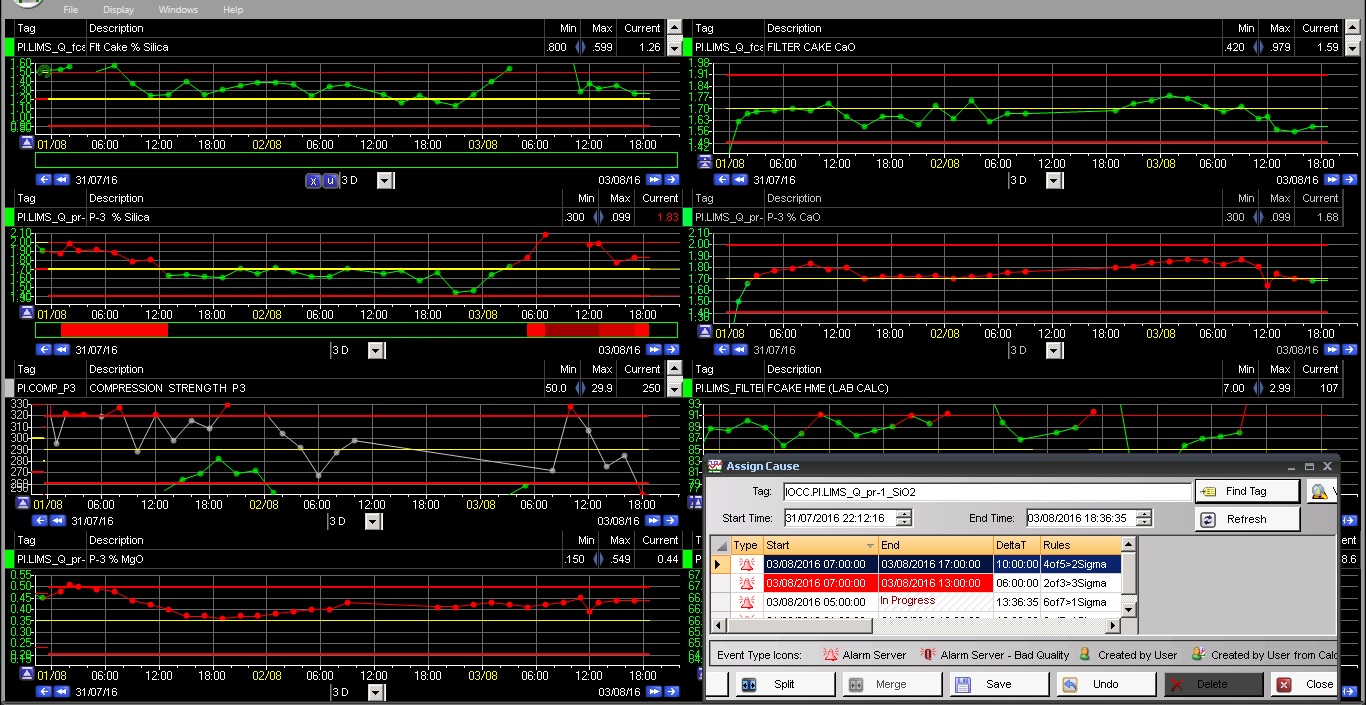
Process-Aware, Flexible, Out of the Box
- Monitor tags against configured limits based on process conditions — including specific grades or products, so limits reflect what's actually normal for that operating condition, not a single generic threshold applied everywhere
- Support grade or product versions for historical comparison, making it possible to see how current performance stacks up against past runs of the same product
- Apply SPC analysis and automation to tags from all data sources — historian, lab, MES, or any other system feeding your process data environment
- Generate control charts with a single click — scatterplots, range charts, and standard deviation charts, built from live data without manual setup each time
- Define limits your way — simple min/max thresholds or custom logic, whichever fits the process
- Manage limits natively or import them from a third-party database, so you're not duplicating limit management across systems
- Visualize SPC metrics with user-defined color coding and real-time feedback, so an out-of-control condition is visually obvious the moment it happens, not buried in a table of numbers
Why SPC Matters for Industrial Operations
Traditional quality control often relies on periodic sampling — checking a batch every so often and reacting after the fact. By the time an out-of-spec result comes back from the lab, the process may have been producing off-quality product for hours. SPC closes that gap by continuously comparing live process behavior against statistically established control limits, flagging deviations as they happen rather than after the damage is done.
This matters most in processes where variability has a direct cost — whether that's wasted raw material, reduced yield, rework, or a product that fails to meet customer specification. Catching a shift in the mean, an increase in variation, or a trend heading toward a limit early gives operations teams the chance to intervene before a deviation becomes a quality event.
How It Fits Into a Broader Analytics Strategy
SPC works best as part of a connected data strategy, not in isolation. Capstone typically implements SPC alongside real-time trending and dashboards, so an SPC-flagged deviation can be immediately investigated in a trend display, and the root cause identified and corrected without switching between disconnected tools.
Why This Matters for Your Plant
If your team's quality control still depends heavily on manual charting or periodic lab sampling, SPC gives you the same statistical rigor running continuously and automatically — catching drift while there's still time to act, not after the batch is already off-spec.