From Scattered Field Data to a Single Real-Time Picture
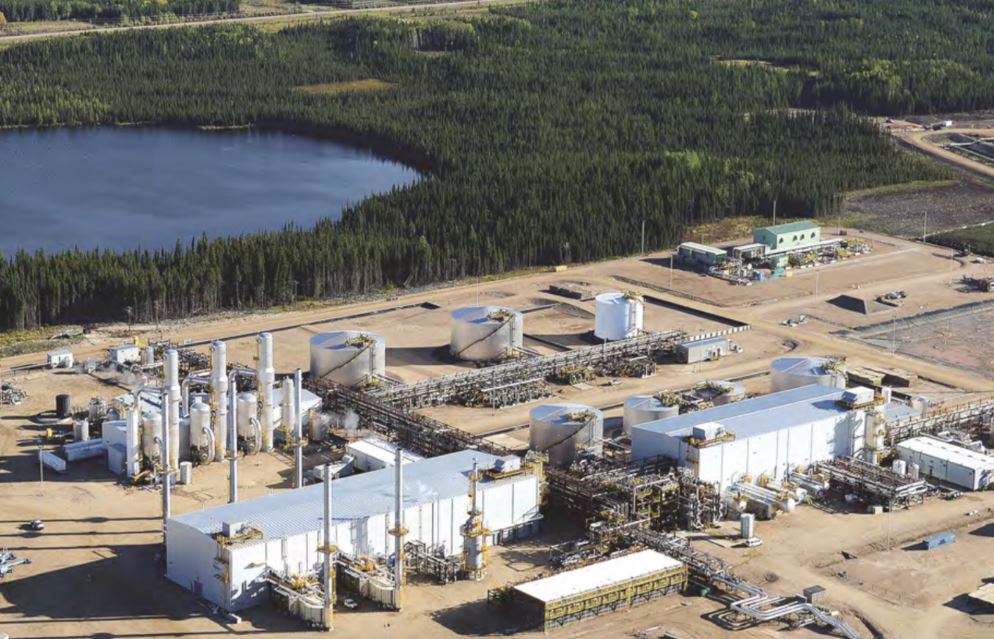
A large SAGD (steam-assisted gravity drainage) facility runs on thousands of continuously changing measurements — steam-to-oil ratios, well pad pressures, injection and production rates, and field device diagnostics — generated around the clock across a wide, often remote footprint. For one client, that data existed, but it wasn't unified: field and plant systems produced it, yet operations and the main office had no single, near-real-time view of what was actually happening across the facility. In an operation where a slipping steam-to-oil ratio or an underperforming well pad can go unnoticed for hours without the right visibility, that gap has a direct cost.
Capstone Technology Canada was brought in to close that gap: build a historian and visualization layer that gave operations and engineering a near-real-time, plant-and-field-wide view, and automate the data integration and validation work that had previously been done by hand.
Building a Single Source of Truth at Scale
The core of the solution is a DataPARC historian configured to collect approximately 100,000 individual data streams, replicated in near-real-time back to the main office alongside PARCview visualization for day-to-day monitoring. At that scale, manual data handling isn't a realistic option — the system needed to validate itself.
To do that, Capstone built a set of custom .NET applications layered on top of the historian:
- Automated Data Validation — applies system-defined rules to incoming plant data continuously, and automatically flags the appropriate staff when it detects an anomaly, rather than waiting for someone to notice a discrepancy during a routine review.
- A Data Validation web application (ASP.NET) — gives engineering staff a straightforward interface to configure validation rules and correct flagged data themselves, without needing a developer involved for routine changes.
- Automated well-test data collection — a custom C#.NET application that captures well-test results in real time as field devices report them, rather than relying on periodic manual transcription from the field.
- Production accounting integration — scheduled jobs move validated production data into the enterprise accounting system automatically, which matters directly for royalty and regulatory reporting accuracy.
On top of the historian, Capstone also built custom enterprise integrations so this data could feed the client's other business systems automatically — synchronizing data and automating processes that had previously required manual handoffs between the field, operations, and the office.
The Results
The facility was able to ramp up to target production levels quickly, with operations and engineering able to troubleshoot issues using a shared, validated data set instead of chasing discrepancies across disconnected sources. Since startup, Capstone has continued working with the client to extend the architecture — adding further integrations and automation as the operation has grown, on top of the same open, scalable foundation.
Why This Matters for Your Facility
SAGD and other upstream operations run on volume and distance — many wells, many pads, spread across a large area, all generating data that only creates value if it reaches the right person, validated, in time to act on it. A historian and visualization platform is only as useful as the validation and integration work behind it; without that, teams end up doing in spreadsheets exactly what this system now does automatically. If your operation is still reconciling field and plant data by hand, this is the kind of project that pays for itself in reduced manual effort alone, before counting the value of catching problems sooner.
Talk to us about upstream data integration and visualization